Industry · Aviation analytics
My contribution
At Intuos Srl, I developed a dashboard serving flight-phase classifiers and operational analytics over recorded telemetry.
Industry work · retrospective evaluation
0.999 weighted F1 in row-level cross-validation, measured against PositionAssigner-derived labels, not verified flight phases; no flight-, aircraft- or time-held-out evaluation.
Problem
Giving operations teams query-on-demand visibility into recorded flight telemetry, engine performance, and phase-of-flight for safety analytics.
System
A full-stack platform (FastAPI + IBM DB2 backend, React/Vite frontend, Dockerised deployment) serves ML-based flight-phase and attitude classifiers over recorded, externally-ETL'd historical telemetry. The flight-phase classifier reaches a weighted F1 of 0.999 in five-fold row-level cross-validation on 278,571 DB2 rows, measured against labels derived from the dashboard's existing PositionAssigner model, not against independently verified flight phases. Auditable deterministic logic, not ML, drives the safety-alarm layer.
Deployment
Developed for internal flight-performance analysis at Intuos Srl.
Evaluation scope
The reported F1 measures agreement with PositionAssigner-derived labels on randomly split rows of recorded telemetry. It is not accuracy against verified flight phases on unseen flights, and not a prospective deployment score. This dashboard provides query-on-demand analysis; the separate audio engine monitor is a personal prototype.
How the system fits together
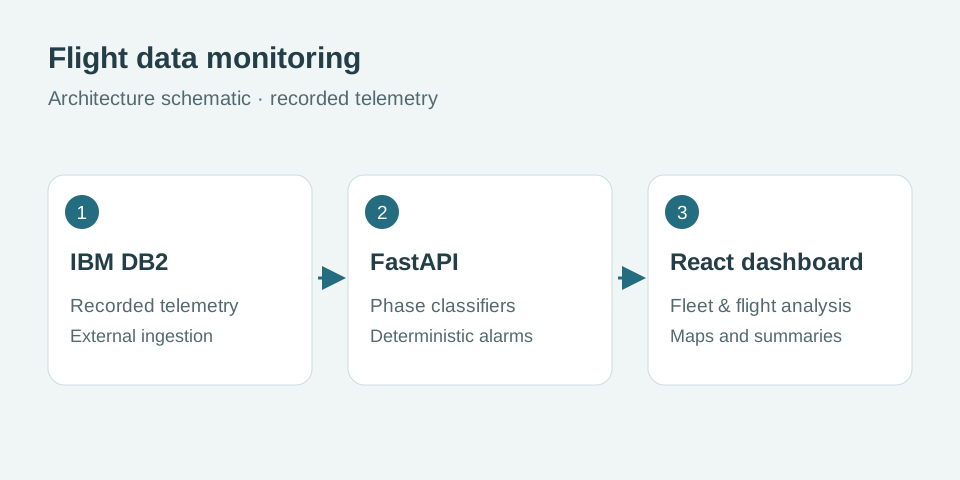
Recorded telemetry is ingested externally into IBM DB2. The dashboard requests analytics through a FastAPI backend; classifiers assign flight phases, while deterministic rules produce safety alarms.
Evaluation protocol & class balance
The saved training notebook uses an 80/20 stratified random split of telemetry rows (random seed 42) and separately calls five-fold cross-validation on all rows. Neither procedure explicitly groups by flight or aircraft, or holds out a future time period. Correlated telemetry may therefore occur across splits; the score does not establish performance on unseen flights or aircraft.
The table reports the separate 55,715-row test split, not the cross-validation folds. Scores are rounded to two decimals in the saved notebook. The dominant flight class accounts for 54,525 rows, so weighted F1 should be read alongside minority-class scores.
| Class | Precision | Recall | F1 | Rows |
|---|---|---|---|---|
| Flight | 1.00 | 1.00 | 1.00 | 54,525 |
| Landing / takeoff | 0.96 | 0.95 | 0.96 | 714 |
| Taxiing | 0.98 | 0.98 | 0.98 | 476 |
The training and test labels are not independent ground truth: both training notebooks take the attitude output of the existing PositionAssigner model as the label, and the three flight phases are that output mapped to coarser classes. The scores therefore measure how well the new classifier reproduces PositionAssigner on randomly split rows. A flight-grouped and chronological evaluation against independently verified labels would be needed to measure accuracy on unseen flights.